chop2chip
Well-known member
Two things to consider.
1) Men and women have different mortality rates. So you would want to disaggregate by sex and take that into account.
2) It is better to go year by year than 10 year buckets. My guess is 59 year olds have worse outcomes than 50 year olds (both vaccinated and unvaccinated). And more 59 year olds are vaccinated than 50 year olds. Rinse and repeat for every 10 year bucket. So if you have the data by year and sex that will give you better comparisons than going by 10 year buckets with both sexes included.
see graph below which does both
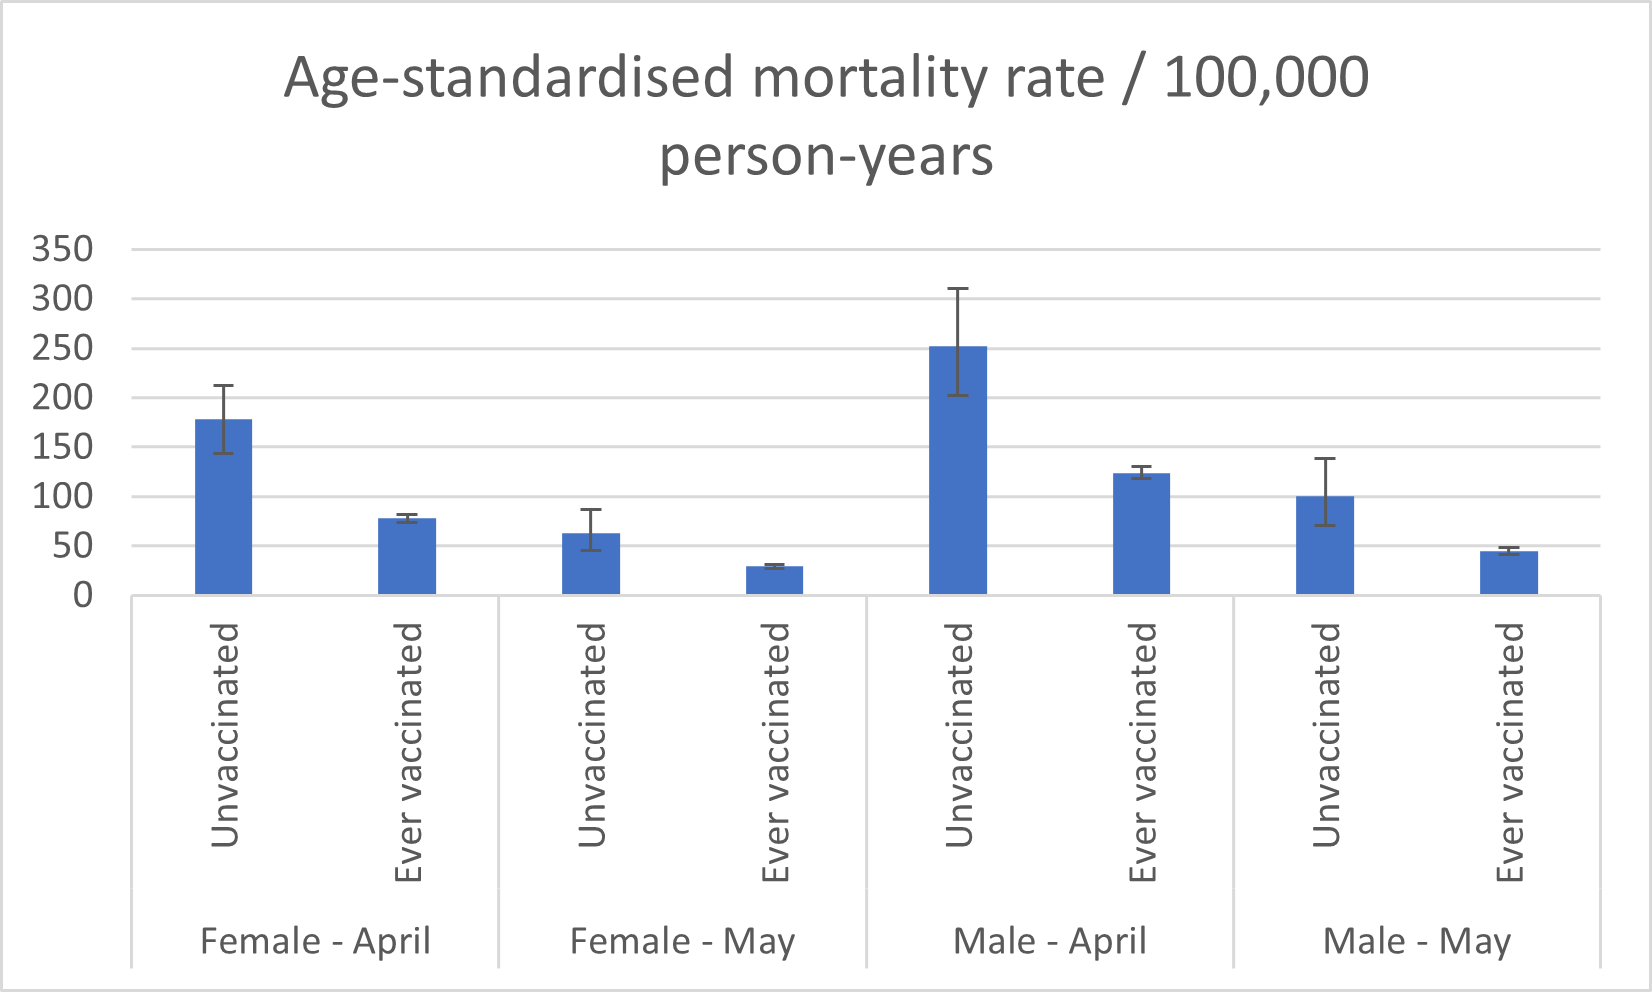
Interesting that the errors bars are much larger on unvaccinated. I wonder why that is.
What’s the Y variable? Is it just deaths? Or specifically C19 cause of deaths.
I think there is compelling evidence that vaccine’s prevented worse outcomes. I think the extent of that is exaggerated, but there’s a correlation for sure (just as there is compelling evidence of side effects). I’m sympathetic to concerns by this specific type of anti-vaxxer, but it’s a little pedantic to say the vaccines do nothing.