nsacpi
Expects Yuge Games
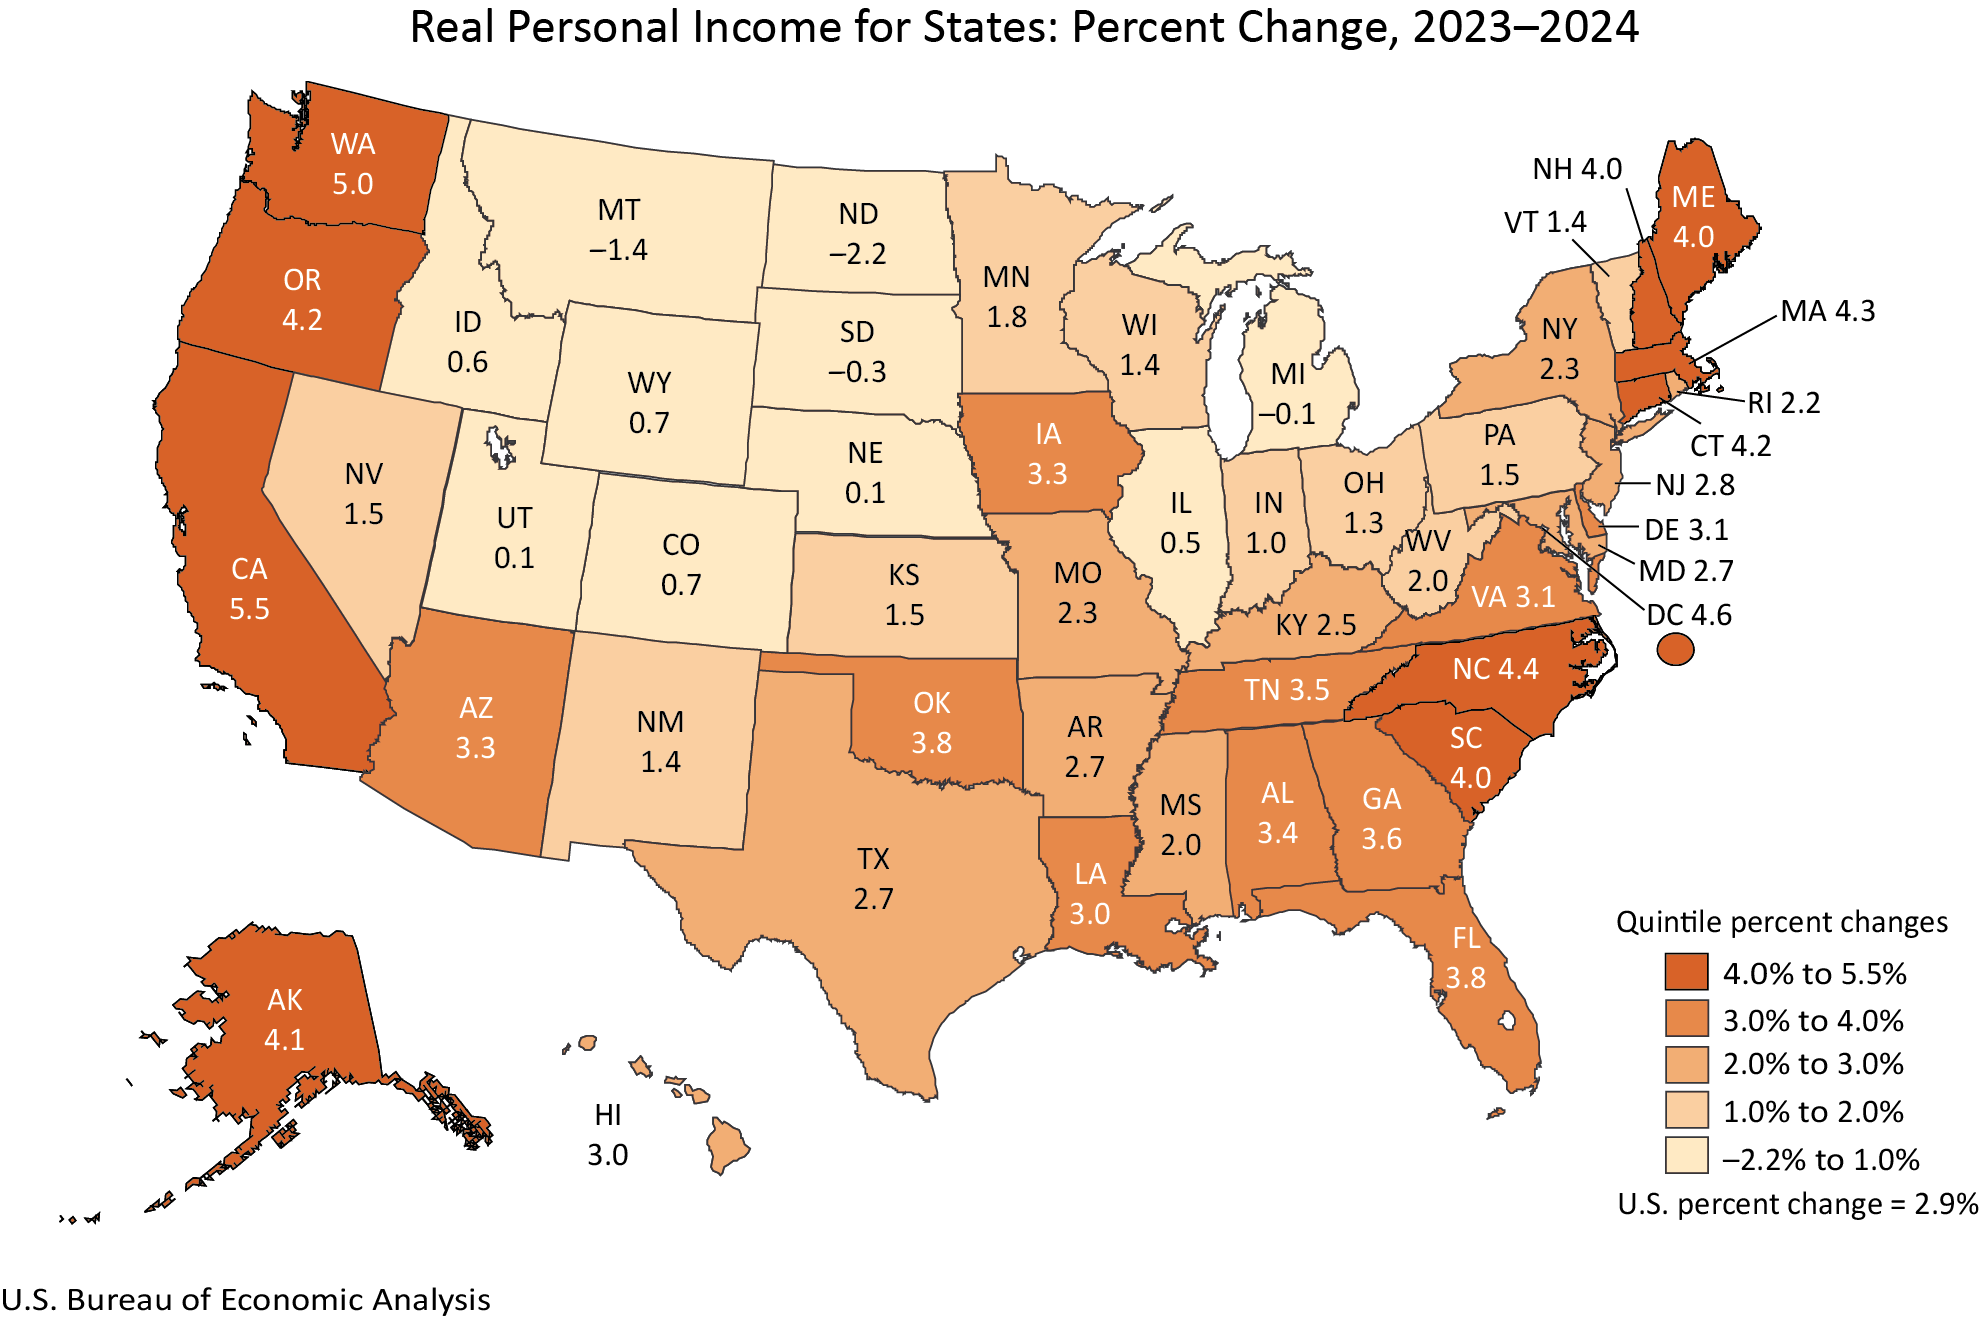
I focus on 2024 because that was the most recent year with fresh data reported last week. Based on the data on inflation and population it appears that real per capita income fell by over 2% in Texas in 2024. So California beating Texas on real per capita income growth is perhaps not that impressive.
But I've also looked at longer periods. Blue states have been doing better on all sorts of metrics. The gaps in terms of life expectancy and other health metrics and economic outcomes have been growing not shrinking. It is a striking thang. But hey blue states have luck and red states have obesity.
But I've also looked at longer periods. Blue states have been doing better on all sorts of metrics. The gaps in terms of life expectancy and other health metrics and economic outcomes have been growing not shrinking. It is a striking thang. But hey blue states have luck and red states have obesity.