You are using an out of date browser. It may not display this or other websites correctly.
You should upgrade or use an alternative browser.
You should upgrade or use an alternative browser.
The Coronavirus, not the beer
- Thread starter Runnin
- Start date
I'm still alive my dudes
Thankfully - back to back WS champs wouldn't be the same without you.
sturg33
I
I'm still alive my dudes
thank God for your vaccine
I'm still alive my dudes
You gotta get your strength back up in order to please Cy's mom.
Thankfully - back to back WS champs wouldn't be the same without you.
Can't wait
You gotta get your strength back up in order to please Cy's mom.
For now I'll let her do all the work
reply to zuby
[tw]1547569383509147654[/tw]
Just eyeballing looks like the unvaccinated are twice as likely to die. Keep pushing the deza boyz. You get an A+ for persistence. Something to write home about.
There is absolutely no evidence to indicate it was a good decision for healthy people to take the vaccine. And everything about far superior immunity post natural infection easily allows the math to work where it never made sense for them to “get the jab”.
An overwhelming percentage of deaths are found in very specific subsets of people. Continuing to pretend otherwise is the true malpractice.
sturg33
I
reply to zuby
[tw]1547569383509147654[/tw]
Just eyeballing looks like the unvaccinated are twice as likely to die. Keep pushing the deza boyz. You get an A+ for persistence. Something to write home about.
Help a non academic expert out...
If I look at say 50-59 year old chart.
I am reading that 13% of the population did not take the life saving jab. And I'm reading that 13% of COVID deaths in May of 22 we're people without a life saving jab
Is that reading it incorrectly?
nsacpi
Expects Yuge Games
Help a non academic expert out...
If I look at say 50-59 year old chart.
I am reading that 13% of the population did not take the life saving jab. And I'm reading that 13% of COVID deaths in May of 22 we're people without a life saving jab
Is that reading it incorrectly?
Two things to consider.
1) Men and women have different mortality rates. So you would want to disaggregate by sex and take that into account.
2) It is better to go year by year than 10 year buckets. My guess is 59 year olds have worse outcomes than 50 year olds (both vaccinated and unvaccinated). And more 59 year olds are vaccinated than 50 year olds. Rinse and repeat for every 10 year bucket. So if you have the data by year and sex that will give you better comparisons than going by 10 year buckets with both sexes included.
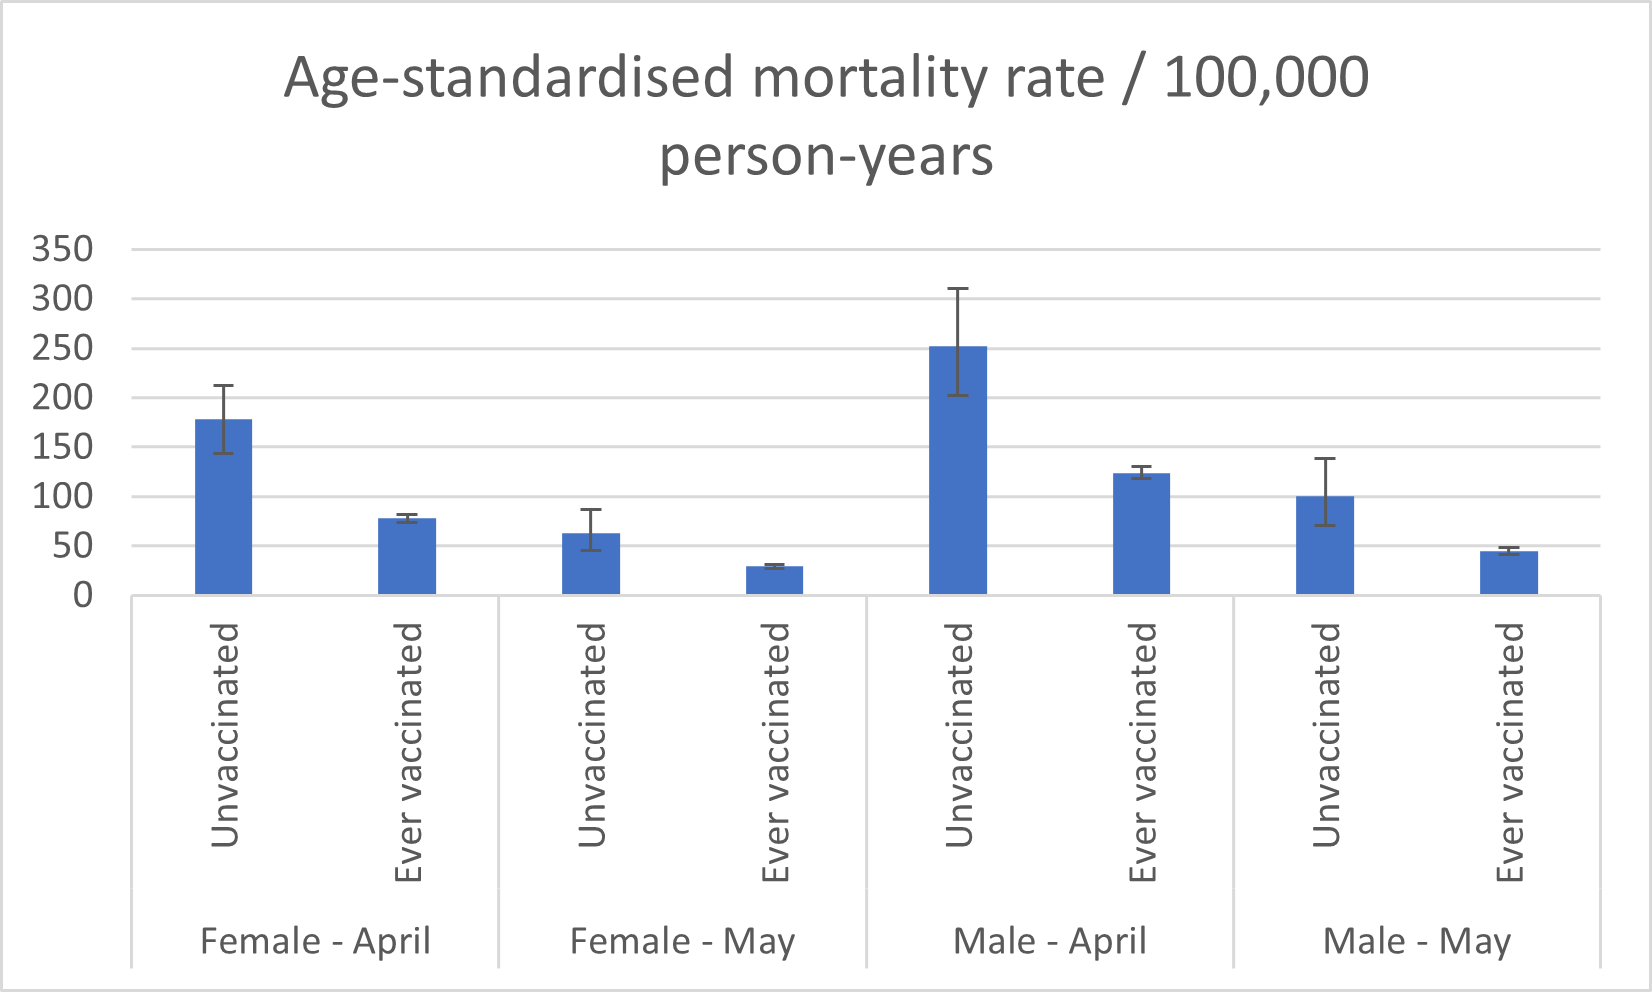
see graph below which does both
Last edited:
sturg33
I
Two things to consider.
1) Men and women have different mortality rates. So you would want to disaggregate by sex and take that into account.
2) It is better to go year by year than 10 year buckets. My guess is 59 year olds have worse outcomes than 50 year olds (both vaccinated and unvaccinated). And more 59 year olds are vaccinated than 50 year olds. Rinse and repeat for every 10 year bucket. So if you have the data by year and sex that will give you better comparisons than going by 10 year buckets with both sexes included.
So was I reading the zuby chart incorrectly or not?
nsacpi
Expects Yuge Games
So was I reading the zuby chart incorrectly or not?
i dunno...there is an expert way of reading it...and other ways of reading it...i don't know which method you were using
sturg33
I
i dunno...there is an expert way of reading it...and other ways of reading it...i don't know which method you were using
I read it as roughly the same percentage of covid deaths were from people unvaccinated as percentage of people who were unvaccinated
nsacpi
Expects Yuge Games
I read it as roughly the same percentage of covid deaths were from people unvaccinated as percentage of people who were unvaccinated
it is a reasonable way to read it
there were some responses to zuby that showed why the graphs might be misleading and it wasn't difficult for me to find them
nsacpi
Expects Yuge Games
oh good... i was worried i was pushing deza for there a minute!!
your reputation precedes you